证券数据集下使用LSTM模型预测A股走势
作者信息:edencfc
更新日期:2022 年 12 月 8 日
摘要: 本示例将会演示如何使用飞桨完成多变量输入的时序数据预测任务。这个任务以一只A股的价格走势作为示例,将会构建一个LSTM网络预测其未来的涨跌情况。
–
2. 环境设置
本示例基于PaddlePaddle 2.4.0 编写,如果你的环境不是本版本,请先参考官网安装 PaddlePaddle 2.4.0。
# 安装mplfinance绘制K线图
!pip install mplfinance==0.12.9b7 -i https://pypi.tuna.tsinghua.edu.cn/simple/ --trusted-host pypi.tuna.tsinghua.edu.cn
%matplotlib inline
import numpy as np
import pandas as pd
import re
from matplotlib import pyplot as plt
from matplotlib.ticker import MultipleLocator
import mplfinance as mpl
import matplotlib.dates as mpdates
from sklearn.preprocessing import MinMaxScaler

# 导入 paddle
import paddle
import paddle.nn.functional as F

print(paddle.__version__)

import warnings

warnings.filterwarnings("ignore")
2.4.0
3. 数据集
3.1 数据下载与查看
Tushare是一个免费、开源的python财经数据接口包。主要实现对股票等金融数据从数据采集、清洗加工到数据存储的过程。Tushare返回的绝大部分的数据格式都是pandas DataFrame类型,非常易于使用。其优点请访问官网。
# 安装tushare
!pip install tushare -i https://pypi.tuna.tsinghua.edu.cn/simple/ --trusted-host pypi.tuna.tsinghua.edu.cn
下载一只股票的k线数据,这里取sz.002648 2020年以后的数据。
import tushare as ts

df = ts.get_hist_data("002648")
本接口即将停止更新,请尽快使用Pro版接口:https://tushare.pro/document/2
在我们获取的历史A股K线数据中,各参数名称含义如下:
date:日期
open:开盘价
high:最高价
close:收盘价
low:最低价
volume:成交量
price_change:价格变动
p_change:涨跌幅
ma5:5日均价
ma10:10日均价
ma20:20日均价
v_ma5:5日均量
v_ma10:10日均量
v_ma20:20日均量
df = df.reset_index()
float_type = [
    "open",
    "high",
    "close",
    "low",
    "volume",
    "price_change",
    "p_change",
    "ma5",
    "ma10",
    "ma20",
    "v_ma5",
    "v_ma10",
    "v_ma20",
    "turnover",
]

for item in float_type:
    df[item] = df[item].astype("float")

df["buy_flag"] = 10
3.2 时间序列数据的展示
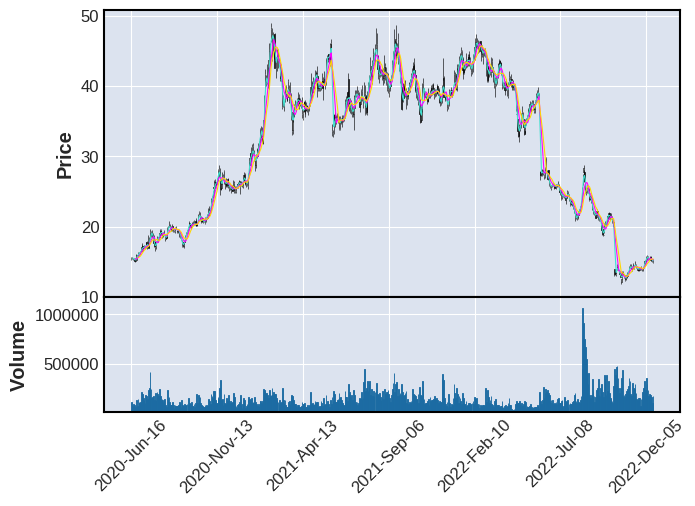
绘制股票K线图
# 删除 tushare 提供的不需要的数据,保留 Date, Open, High, Low, Close, Volume
df_plots = df[["date", "open", "high", "low", "close", "volume"]]
# 对数据进行改名,mplfinance名字必须是Date, Open, High, Low, Close, Volume
df_plots.rename(
    columns={
        "date": "Date",
        "open": "Open",
        "high": "High",
        "low": "Low",
        "close": "Close",
        "volume": "Volume",
    },
    inplace=True,
)
# 时间倒序改为正序
df_plots = df_plots[::-1]
# 把Date列数据设置成索引
df_plots.set_index(["Date"], inplace=True)
# 把Date列数据装换成datetime格式
df_plots.index = pd.to_datetime(df_plots.index)
mpl.plot(df_plots, type="candle", mav=(3, 6, 9), volume=True)

3.3 数据集的处理
用 LSTM 预测价格显示是不合理的,因为价格的波动非常不可控,所以我们退而求其次,预测股票的走势,即涨还是跌。
但是怎么量化股票的涨跌是个问题,这里我们用未来数天的平均股价表示股票的起伏。
# 未来n天移动平均,包含今天
def MA_next(df, date_idx, price_type, n):
    return df[price_type][date_idx : date_idx + n].mean()
假设短期2天,中期6天,长期15天。如果未来15天平均价格大于未来6天平均价格大于未来2天平均价格,我们就可认为未来15天的股市走势很好。 这里还要求有3%的涨幅,能一定程度上减少标签频繁波动。
2 含义为买入,0 含义为卖出,1 为默认值
s_time = 2
m_time = 6
l_time = 15

for i in range(len(df) - l_time):
    if (
        MA_next(df, i, "close", l_time)
        > MA_next(df, i, "close", m_time) * 1.03
        > MA_next(df, i, "close", s_time) * 1.03
    ):
        df.loc[i, "buy_flag"] = 2
    elif MA_next(df, i, "close", s_time) > MA_next(df, i, "close", m_time):
        df.loc[i, "buy_flag"] = 0
    else:
        df.loc[i, "buy_flag"] = 1
df = df.reset_index()
通过使用函数add_datepart,能计算当前日期的年、月、日、一周第几天、周数、月初月末、一年当中的第几天等信息。本项目用该函数扩展日期特征。
def ifnone(if_, else_, transform=None):
    """Returns the condition ``if_`` iff it is not ``None``, or if a transformation is
    specified, ``transform(if_)``. Returns ``else_`` if the condition is ``None``.
    ``transform`` can be any callable, which will be passed ``if_`` in case ``if_`` is not ``None``."""
    if if_ is None:
        return else_
    else:
        if transform is not None:
            return transform(if_)
        else:
            return if_
def make_date(df, date_field):
    "Make sure `df[date_field]` is of the right date type."
    field_dtype = df[date_field].dtype
    if isinstance(field_dtype, pd.core.dtypes.dtypes.DatetimeTZDtype):
        field_dtype = np.datetime64
    if not np.issubdtype(field_dtype, np.datetime64):
        df[date_field] = pd.to_datetime(
            df[date_field], infer_datetime_format=True
        )
def add_datepart(df, field_name, prefix=None, drop=True, time=False):
    "Helper function that adds columns relevant to a date in the column `field_name` of `df`."
    make_date(df, field_name)
    field = df[field_name]
    prefix = ifnone(prefix, re.sub("[Dd]ate$", "", field_name))
    attr = [
        "Year",
        "Month",
        "Week",
        "Day",
        "Dayofweek",
        "Dayofyear",
        "Is_month_end",
        "Is_month_start",
        "Is_quarter_end",
        "Is_quarter_start",
        "Is_year_end",
        "Is_year_start",
    ]
    if time:
        attr = attr + ["Hour", "Minute", "Second"]
    # Pandas removed `dt.week` in v1.1.10
    week = (
        field.dt.isocalendar().week.astype(field.dt.day.dtype)
        if hasattr(field.dt, "isocalendar")
        else field.dt.week
    )
    for n in attr:
        df[prefix + n] = getattr(field.dt, n.lower()) if n != "Week" else week
    mask = ~field.isna()
    df[prefix + "Elapsed"] = np.where(
        mask, field.values.astype(np.int64) // 10**9, np.nan
    )
    if drop:
        df.drop(field_name, axis=1, inplace=True)
    return df
接下来我们为数据生成序列,用前seq_length天的信息作为输入序列,后1天的股市起伏buy_flag作为标签
# 增加日期特征
add_datepart(df, "date", drop=False)
seq_length = 30
train_df = df[seq_length:-seq_length]
# 丢掉不重要的特征
train_df = train_df.drop(
    [
        "date",
        "Is_month_end",
        "Is_month_start",
        "Is_quarter_end",
        "Is_quarter_start",
        "Is_year_end",
        "Is_year_start",
        "Dayofyear",
    ],
    axis=1,
)
train_df
| open | high | close | low | volume | price_change | p_change | ma5 | ma10 | ma20 | ... | v_ma10 | v_ma20 | turnover | buy_flag | Year | Month | Week | Day | Dayofweek | Elapsed | |
|---|---|---|---|---|---|---|---|---|---|---|---|---|---|---|---|---|---|---|---|---|---|
| 30 | 12.93 | 13.55 | 13.47 | 12.90 | 241943.56 | 0.35 | 2.67 | 12.966 | 13.007 | 14.769 | ... | 242648.57 | 272838.11 | 0.72 | 0.0 | 2022 | 11 | 44 | 3 | 3 | 1.667434e+09 |
| 31 | 13.06 | 13.36 | 13.12 | 12.75 | 227246.02 | 0.01 | 0.08 | 12.922 | 13.011 | 15.157 | ... | 243501.67 | 268506.72 | 0.68 | 0.0 | 2022 | 11 | 44 | 2 | 2 | 1.667347e+09 |
| 32 | 12.57 | 13.13 | 13.11 | 12.44 | 192092.44 | 0.71 | 5.73 | 12.966 | 13.091 | 15.569 | ... | 255853.39 | 267215.59 | 0.57 | 2.0 | 2022 | 11 | 44 | 1 | 1 | 1.667261e+09 |
| 33 | 12.60 | 12.78 | 12.40 | 12.35 | 161863.20 | -0.33 | -2.59 | 12.858 | 13.226 | 16.011 | ... | 284628.12 | 273649.04 | 0.48 | 2.0 | 2022 | 10 | 44 | 31 | 0 | 1.667174e+09 |
| 34 | 13.25 | 13.31 | 12.73 | 12.70 | 179966.20 | -0.52 | -3.92 | 12.946 | 13.371 | 16.465 | ... | 314846.22 | 276921.36 | 0.54 | 2.0 | 2022 | 10 | 43 | 28 | 4 | 1.666915e+09 |
| ... | ... | ... | ... | ... | ... | ... | ... | ... | ... | ... | ... | ... | ... | ... | ... | ... | ... | ... | ... | ... | ... |
| 574 | 18.96 | 19.70 | 19.35 | 18.61 | 169411.69 | 0.18 | 0.94 | 18.748 | 18.209 | 18.046 | ... | 179920.59 | 192464.21 | 1.63 | 0.0 | 2020 | 8 | 32 | 5 | 2 | 1.596586e+09 |
| 575 | 18.74 | 19.42 | 19.17 | 18.50 | 242817.44 | 0.60 | 3.23 | 18.430 | 18.178 | 17.933 | ... | 178646.61 | 191634.64 | 2.34 | 0.0 | 2020 | 8 | 32 | 4 | 1 | 1.596499e+09 |
| 576 | 18.51 | 18.87 | 18.57 | 18.35 | 176309.28 | 0.27 | 1.48 | 18.016 | 18.161 | 17.819 | ... | 179127.83 | 188992.10 | 1.70 | 0.0 | 2020 | 8 | 32 | 3 | 0 | 1.596413e+09 |
| 577 | 18.39 | 18.58 | 18.30 | 17.83 | 193190.16 | -0.05 | -0.27 | 17.756 | 18.227 | 17.749 | ... | 203306.86 | 190843.41 | 1.86 | 0.0 | 2020 | 7 | 31 | 31 | 4 | 1.596154e+09 |
| 578 | 18.16 | 18.64 | 18.35 | 17.79 | 215596.52 | 0.59 | 3.32 | 17.624 | 18.190 | 17.660 | ... | 209209.51 | 187087.72 | 2.08 | 0.0 | 2020 | 7 | 31 | 30 | 3 | 1.596067e+09 |
549 rows × 21 columns
# 数据清洗,填充nan值
train_df = train_df.fillna(0)
3.4 构造训练集与验证集
def sliding_windows(data, label, seq_length):
    x = []
    y = []

    for i in range(len(data) - seq_length - 1):
        _x = data[i : (i + seq_length)]
        _y = label[i + seq_length]
        x.append(_x)
        y.append(_y)

    return np.array(x), np.array(y)
# 数据归一化
y_scaler = MinMaxScaler()
x_scaler = MinMaxScaler()

X = train_df.drop(["buy_flag"], axis=1).values
X = x_scaler.fit_transform(X)
Y = train_df["buy_flag"]
Y = np.array(Y).reshape(-1, 1)

x, y = sliding_windows(X, Y, seq_length)

y_train, y_test = y[: int(y.shape[0] * 0.8)], y[int(y.shape[0] * 0.8) :]
x_train, x_test = x[: int(x.shape[0] * 0.8)], x[int(x.shape[0] * 0.8) :]
class MyDataset(paddle.io.Dataset):
    """
    步骤一:继承paddle.io.Dataset类
    """

    def __init__(self, x, y):
        """
        步骤二:实现 __init__ 函数,初始化数据集,将样本和标签映射到列表中
        """
        super(MyDataset, self).__init__()
        self.data = paddle.to_tensor(x.transpose(1, 0, 2), dtype="float32")
        self.label = paddle.to_tensor(y, dtype="float32")

    def __getitem__(self, index):
        """
        步骤三:实现__getitem__函数,定义指定index时如何获取数据,并返回单条数据(样本数据、对应的标签)
        """
        data = self.data[index]
        label = self.label[index]
        return data, label

    def __len__(self):
        """
        步骤四:实现__len__方法,返回数据集总数目
        """
        return len(self.data)


# 实例化数据集
train_dataset = MyDataset(x_train, y_train)
eval_dataset = MyDataset(x_test, y_test)
# 查看数据样本
x_train[0][8]
array([0.02669633, 0.02337734, 0.01220189, 0.02822229, 0.21558632,
       0.49770115, 0.3485    , 0.02159498, 0.05927717, 0.10762601,
       0.35886254, 0.51202575, 0.66379212, 0.13411765, 1.        ,
       0.81818182, 0.80769231, 0.76666667, 0.        , 0.98789346])
x_train.shape
(414, 30, 20)
y_train.shape
(414, 1)
4. 模型组网
本项目构造了简单的LSTM层,具体步骤如下:
连接LSTM层,从时间步的维度进行时序建模。
通过全连接层输出预测值。
模型的损失函数选择为均方误差,优化方法采用adam优化器。
class LSTM(paddle.nn.Layer):
    def __init__(self, num_classes, input_size, hidden_size, num_layers):
        super(LSTM, self).__init__()

        self.num_classes = num_classes
        self.num_layers = num_layers
        self.input_size = input_size
        self.hidden_size = hidden_size
        self.seq_length = seq_length
        self.lstm = paddle.nn.LSTM(
            input_size=input_size,
            hidden_size=hidden_size,
            num_layers=num_layers,
        )
        # self.relu = paddle.nn.ReLU()
        self.fc = paddle.nn.Linear(hidden_size, num_classes)
        # self.relu = paddle.nn.ReLU()
        # self.head = paddle.nn.Linear(int(hidden_size/2), out_features=num_classes)

    def forward(self, x):
        x, (h, c) = self.lstm(x)
        # print(h)
        # x = x[:,-1,:]
        h = h[-1]
        x = self.fc(h)
        # x = self.head(x)
        # print(out)
        return x
# 打印网络结构
model = LSTM(128, 18, 300, 1)
paddle.summary(model, (30, 796, 18))
W1216 14:17:20.358139  4248 gpu_resources.cc:61] Please NOTE: device: 0, GPU Compute Capability: 7.0, Driver API Version: 11.2, Runtime API Version: 11.2
W1216 14:17:20.361869  4248 gpu_resources.cc:91] device: 0, cuDNN Version: 8.2.


-----------------------------------------------------------------------------------------------------
 Layer (type)       Input Shape                       Output Shape                      Param #
=====================================================================================================
    LSTM-2        [[30, 796, 18]]    [[30, 796, 300], [[1, 30, 300], [1, 30, 300]]]     384,000
   Linear-1         [[30, 300]]                        [30, 128]                        38,528
=====================================================================================================
Total params: 422,528
Trainable params: 422,528
Non-trainable params: 0
-----------------------------------------------------------------------------------------------------
Input size (MB): 1.64
Forward/backward pass size (MB): 54.82
Params size (MB): 1.61
Estimated Total Size (MB): 58.08
-----------------------------------------------------------------------------------------------------


{'total_params': 422528, 'trainable_params': 422528}
5. 模型训练
使用模型网络结构和数据集进行模型训练。
在高层API中,可以用 paddle.Model 完成模型封装后,然后通过 Model.prepare 进行训练前的配置准备工作,包括设置优化算法、Loss 计算方法、评价指标计算方法;接着通过Model.fit接口来启动训练。
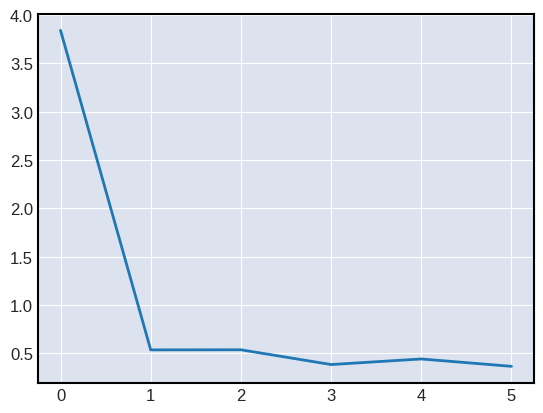
在训练过程中,需要根据模型训练过程中loss,打印loss下降曲线来调参。为了保存训练时每个batch的loss信息,需要自己定义Callback函数,完成模型训练时loss信息的记录。
# 自定义Callback 需要继承基类 Callback
class LossCallback(paddle.callbacks.Callback):
    def __init__(self):
        self.losses = []

    def on_train_begin(self, logs={}):
        # 在fit前 初始化losses,用于保存每个batch的loss结果
        self.losses = []

    def on_train_batch_end(self, step, logs={}):
        # 每个batch训练完成后调用,把当前loss添加到losses中
        self.losses.append(logs.get("loss"))


loss_log = LossCallback()
from paddle.static import InputSpec

# 参数设置
num_epochs = 15
learning_rate = 5e-4

input_size = train_df.shape[1] - 1  # 输入的变量指标数量
hidden_size = 300  # 隐藏状态 h 大小
num_layers = 1  # 循环网络的层数

num_classes = 1  # 输出的特征数
batch_size = 8

model = paddle.Model(LSTM(num_classes, input_size, hidden_size, num_layers))

lr_schedual = paddle.optimizer.lr.CosineAnnealingDecay(
    learning_rate=learning_rate, T_max=num_epochs, verbose=False
)
# 设置优化器,学习率,并且把模型参数给优化器
opt = paddle.optimizer.Adam(
    learning_rate=learning_rate,
    parameters=model.parameters(),
    beta1=0.9,
    beta2=0.999,
)

model.prepare(opt, paddle.nn.MSELoss(), paddle.metric.Accuracy())

model.fit(
    train_dataset,
    eval_dataset,
    epochs=num_epochs,
    batch_size=batch_size,
    eval_freq=10,
    save_freq=10,
    save_dir="lstm_checkpoint",
    verbose=1,
    drop_last=False,
    shuffle=False,
    callbacks=[loss_log],
)
The loss value printed in the log is the current step, and the metric is the average value of previous steps.
Epoch 1/15
step 4/4 [==============================] - loss: 1.0933 - acc: 0.3000 - 22ms/step
save checkpoint at /home/aistudio/lstm_checkpoint/0
Eval begin...
step 4/4 [==============================] - loss: 0.4172 - acc: 0.4667 - 4ms/step
Eval samples: 30
Epoch 2/15
step 4/4 [==============================] - loss: 0.9002 - acc: 0.3000 - 21ms/step
Epoch 3/15
step 4/4 [==============================] - loss: 1.0754 - acc: 0.3000 - 21ms/step
Epoch 4/15
step 4/4 [==============================] - loss: 1.1614 - acc: 0.3000 - 19ms/step
Epoch 5/15
step 4/4 [==============================] - loss: 0.9959 - acc: 0.3000 - 19ms/step
Epoch 6/15
step 4/4 [==============================] - loss: 0.9359 - acc: 0.3000 - 19ms/step
Epoch 7/15
step 4/4 [==============================] - loss: 0.9251 - acc: 0.3000 - 19ms/step
Epoch 8/15
step 4/4 [==============================] - loss: 0.9358 - acc: 0.3000 - 19ms/step
Epoch 9/15
step 4/4 [==============================] - loss: 0.9616 - acc: 0.3000 - 19ms/step
Epoch 10/15
step 4/4 [==============================] - loss: 0.9845 - acc: 0.3000 - 19ms/step
Epoch 11/15
step 4/4 [==============================] - loss: 0.9746 - acc: 0.3000 - 19ms/step
save checkpoint at /home/aistudio/lstm_checkpoint/10
Eval begin...
step 4/4 [==============================] - loss: 0.2339 - acc: 0.4667 - 4ms/step
Eval samples: 30
Epoch 12/15
step 4/4 [==============================] - loss: 0.9414 - acc: 0.3000 - 20ms/step
Epoch 13/15
step 4/4 [==============================] - loss: 0.9167 - acc: 0.3000 - 20ms/step
Epoch 14/15
step 4/4 [==============================] - loss: 0.9058 - acc: 0.3000 - 19ms/step
Epoch 15/15
step 4/4 [==============================] - loss: 0.8950 - acc: 0.3000 - 19ms/step
save checkpoint at /home/aistudio/lstm_checkpoint/final
# 可视化 loss
log_loss = [loss_log.losses[i] for i in range(0, len(loss_log.losses), 10)]
plt.figure()
plt.plot(log_loss)
[<matplotlib.lines.Line2D at 0x7fa0908fee10>]

6. 模型评估
评估指标(Metric)用来衡量一个模型的效果, 一般是通过计算模型的预测结果和真实结果之间的某种差距。
使用Paddle高层API的Model.evaluate接口可以一键完成模型评估操作,结束后根据在Model.prepare中定义的loss和metric计算并返回相关评估结果。
model.load("lstm_checkpoint/final")
# 用 evaluate 在测试集上对模型进行验证
eval_result = model.evaluate(eval_dataset, batch_size=batch_size, verbose=1)
print(eval_result)
Eval begin...
step 4/4 [==============================] - loss: 0.2282 - acc: 0.4667 - 4ms/step
Eval samples: 30
{'loss': [0.22817002], 'acc': 0.4666666666666667}
7. 模型预测
对模型进行预测,展示效果。高层API中提供了Model.predict接口,可对训练好的模型进行推理验证。只需传入待执行推理验证的样本数据,即可计算并返回推理结果。
model.load("lstm_checkpoint/final")
test_result = model.predict(eval_dataset)
# 由于模型是单一输出,test_result的形状为[1, N],N是测试数据集的数据量。这里打印第一个数据的预测结果。
print(len(test_result))
print(test_result[0][0])
print(
    "预测值:{0}, 实际值:{1}".format(test_result[0][0][0], eval_dataset[0][1][0])
)
Predict begin...
step 30/30 [==============================] - 2ms/step
Predict samples: 30
1
[[0.54194236]]
预测值:[0.54194236], 实际值:Tensor(shape=[1], dtype=float32, place=Place(gpu:0), stop_gradient=True,
       [1.])